Samsung GT-P1000 versus Sanei N79 manufactured by AMPERE
21st April 2013
Quadrant Score benchmarking.
| Sanei N79 3G, 1Ghz dual core, 512mb, 4G rom + storage | Samsung GT-P1000, 1Ghz, 512mb, 16G rom + storage | |||||||||||||
| Total | CPU | Mem | I/O | 2D | 3D | Total | CPU | Mem | I/O | 2D | 3D | |||
| dual core 1Ghz | 2635 | 5438 | 1320 | 4619 | 509 | 1288 | 1.4Ghz | 1511 | 2009 | 1755 | 1046 | 1000 | 1745 | |
| 2506 | 4946 | 1138 | 4585 | 501 | 1361 | 1493 | 2071 | 1760 | 1044 | 1014 | 1574 | |||
| 2496 | 5195 | 1219 | 4168 | 509 | 1388 | 1490 | 2131 | 1741 | 1065 | 1006 | 1606 | |||
| 2489 | 4968 | 1220 | 4435 | 500 | 1384 | 1477 | 2059 | 1772 | 1074 | 1006 | 1476 | |||
| 2308 | 5506 | 1259 | 3327 | 420 | 1029 | 1454 | 1990 | 1773 | 1045 | 998 | 1472 | |||
| 2291 | 5204 | 1089 | 3569 | 505 | 1088 | 1401 | 2001 | 1772 | 1314 | 336 | 1583 | |||
| 2248 | 5031 | 1081 | 3665 | 485 | 977 | 1349 | 2005 | 1751 | 1033 | 333 | 1622 | |||
| 2210 | 4618 | 1249 | 3282 | 585 | 1315 | 1346 | 1998 | 1730 | 1120 | 317 | 1566 | |||
| 1986 | 4654 | 1021 | 3133 | 394 | 729 | 1312 | 1596 | 1665 | 903 | 990 | 1405 | |||
| 1765 | 4972 | 1119 | 1336 | 629 | 770 | 1Ghz | 1193 | 1427 | 1721 | 981 | 333 | 1502 | ||
| 1698 | 4545 | 1099 | 1562 | 689 | 596 | 1167 | 1416 | 1757 | 868 | 285 | 1510 | |||
| 1674 | 4061 | 1020 | 2006 | 400 | 879 | 1163 | 1415 | 1751 | 892 | 314 | 1445 | |||
| 1673 | 4061 | 1020 | 2006 | 420 | 879 | |||||||||
| 1370 | 4032 | 623 | 1259 | 467 | 467 | |||||||||
| 1307 | 3745 | 655 | 1413 | 325 | 399 | |||||||||
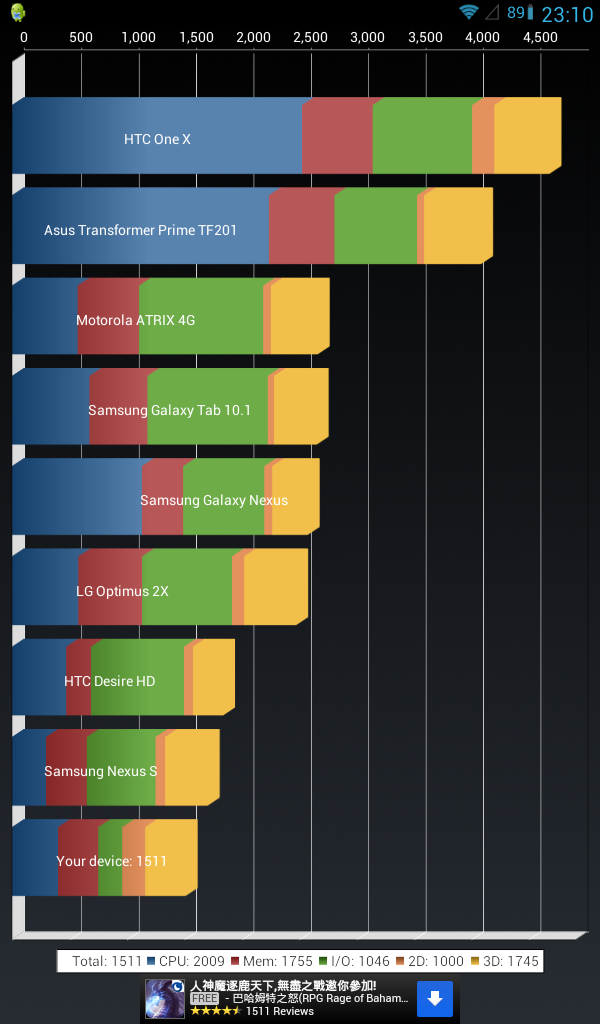
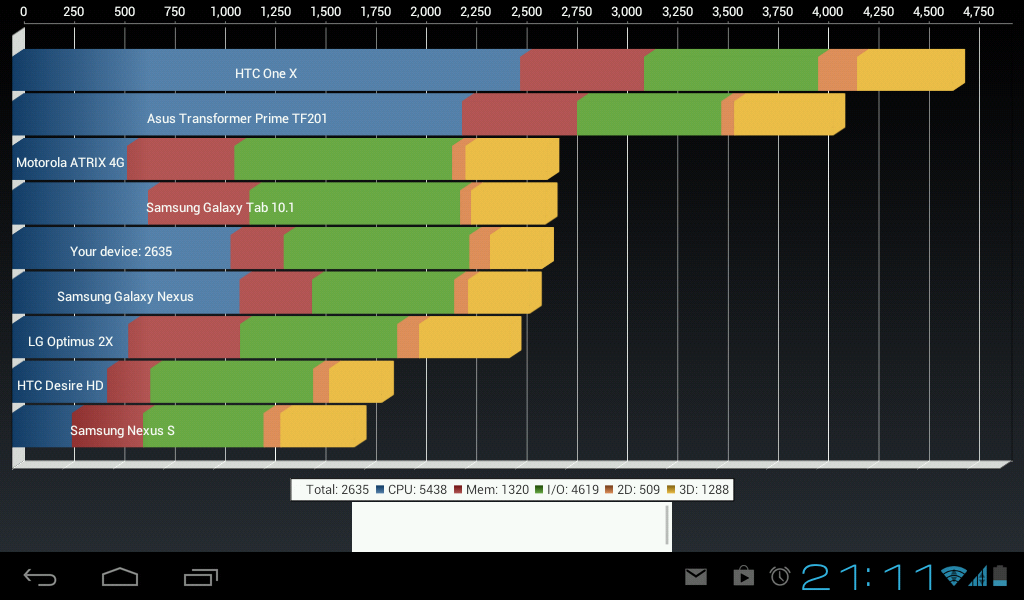
The N79 scores average 2400, versus P1000 1400 using overclocked CPU to 1.4Ghz.
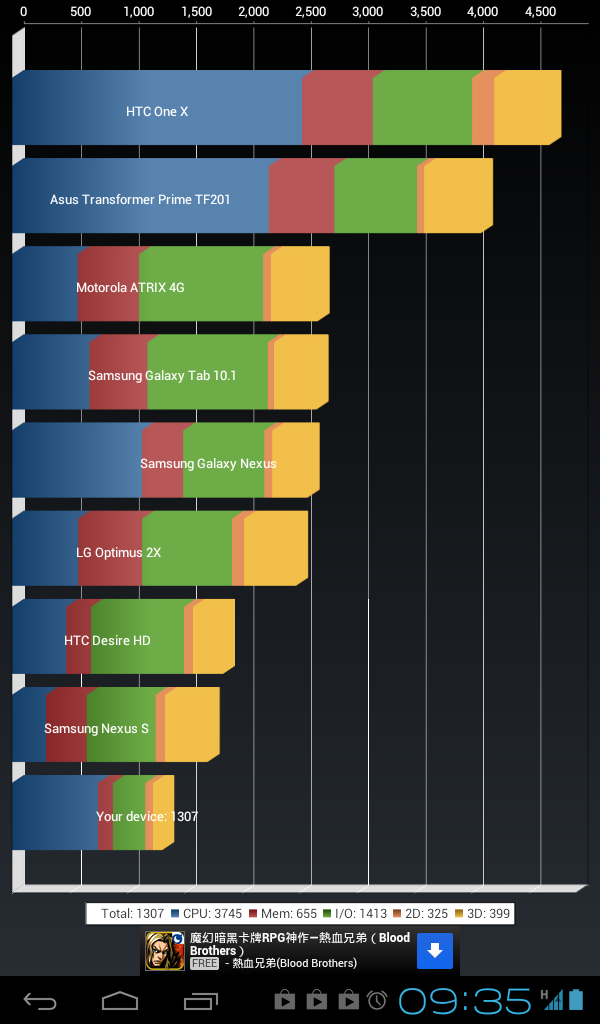
Take a closer look, N79 fluctuates in performance as high as 2635 down to 1307. 100% difference. While the P1000 is extremely consistent. A mere 1511 versus 1312, keeping same CPU speed in mind. 10% difference, much more acceptable.
N79 CPU beats the crap out of P1000, but so what? it's lousy software implementation LAGs so much, display hangs so long time, apps close and reopens, i.e. keyboard pops up and down and ups and down, typed words get lost and retype and lost, so frustrating.
Memory speed on P1000 is much higher by 40% and again the consistency is so good, while N79 cannot hold it's ground, dropping as low as 623.
Input/Output is worst on N79 from 4619 to 1259. Again the P1000 although lower, but super consistent from 1074 to 903, within 10% torelance. A fluke 1314 was registered.
Then this is the IMPORTANT part. 2 DIMENSION graphics. consistent 300 or 1000. Why the sudden gap? 300 is the standard score, while 1000 is "enforce GPU rendering for all 2D". This worked on the P1000 by rom, but it obviously didn't work on the N79. Again software development is BAD.
Finally 3D, a 400% fluctuation from N79 from 1388 to 399. This is just so bad. While surprisingly the P1000's 3D lowest score is 1405, higher than N79 highest. Then P1000's highest is 1745. WoW.
Highest total scores, P1000 versus N79. Then lowest total scores.
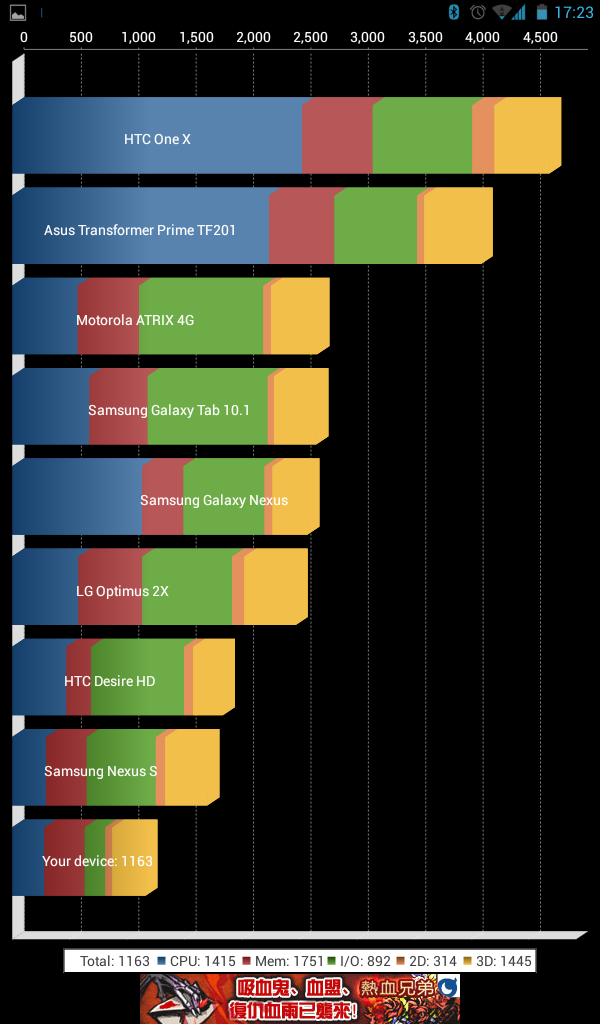
Then lowest total scores. P1000 left using 1Ghz, N79 right.
 versus
Notice N79, nearly 50% of the score is CPU alone, while other support are nearly dead. While P1000 is spread evenly, no wonder it runs smooth.
ACOUSTICS SECTION AUDIO SECTION CAR SECTION
HOME - Technical Website for Acoustics, Audio and Car
 Malaysia
Boleh
Malaysia
Boleh