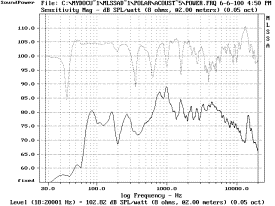
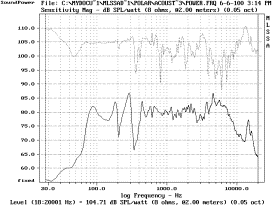
MLSSA’s technique of Sound Power is derived from post processing of Polar Response of horizontal and vertical axis at 15° interval. Two curves are produced, Sound Power and Directivity Index. After the post processing procedures, the feature “Calculate Level” is used to determine their overall level.
Note: This procedure was design for conventional cone speaker and has been mention by sensored® as not appropriate because the procedure is not suitable for DML’s.
|
The
name on top of each graphs meaning |
|
|
Measurement
System |
: |
MLSSA |
|
(1)
panel material (3 different kind) |
|
|
Mic
to Source Distance |
: |
2
meter |
|
(2)
panel size in 10cm multiplication |
|
|
Acquisition
Length |
: |
3637 |
|
Eg.
sensored
= sensored
or sensored
(mm) |
|
|
Antialiasing
Filter |
: |
Chebyshev |
|
ceiling
= sensored
(mm) |
|
|
Bandwidth |
: |
20Hz
to 20kHz |
|
sensored = sensored (mm) both open back |
|
|
FFT
Window |
: |
Rectangular |
|
all
panel is sensored,
otherwise noted |
|
|
FFT
Size |
: |
16384 |
|
all
panels uses sensored
exciters |
|
|
Best
Resolution |
: |
3.7Hz |
|
all
exciters position is sensored
rules |
|
|
FFT
Mode |
: |
Sensitivity
8W
- 2m |
|
all
suspension is sensored,
unless stated |
|
|
FFT
start to end time |
: |
5.841ms
to 55.839ms |
|
At
the end of each graph X+Y=Z is estimated level |
|
|
Location
|
: |
Anechoic
Chamber |
The straight line curve is Sound Power, while the dotted line curve is Directivity Index. +Y=13 means scaled up to 20watts RMS, figure on left is Sound Power, figures on right is Directivity Index both calculated by MLSSA.
sensored sensored sensored sensored sensored


79.07+13=92.07 102.82+13=115.82 79.14+13=92.14 104.73+13=117.73
sensored sensored sensored sensored
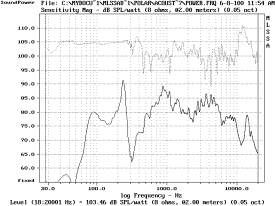
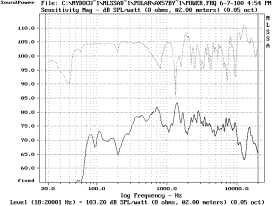
80.56+13=93.56 103.46+13=116.46 74.82+13=87.82 103.20+13=116.20
sensored sensored sensored sensored
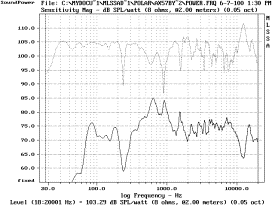
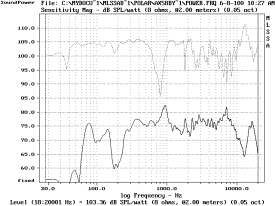
75.25+13=88.25 103.29+13=116.29 74.52+13=87.52 103.36+13=116.36
sensored sensored sensored sensored sensored
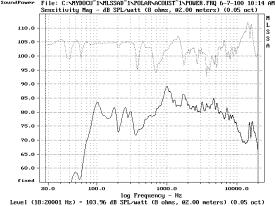
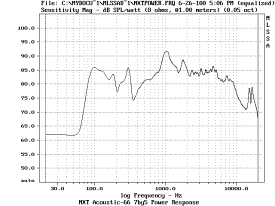
80.09+13=93.09 103.96+13=116.96 83.07+13=96.07
On the left is Sound Power by MLSSA, on the right is Power Response by sensored ®. The result was given by sensored sensored in TXT format then imported into MLSSA. The exact same panel is used for both measurements. Both curve looks nearly identical; therefore, the MLSSA method is not entirely doubtable. However sensored ® response is 3dB higher overally. Why? Unknown at the moment, possibly due to summation, averaging difference in method or error here and there, who knows?
sensored sensored sensored sensored sensored sensored sensored sensored sensored sensored
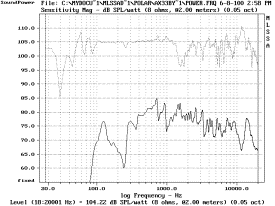
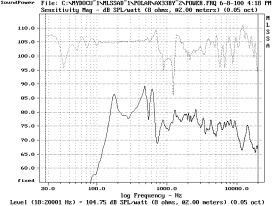
75.97+13=88.97 104.22+13=117.22 78.16+13=91.16 104.75+13=117.75
It is surprising to find the overall level of all panels are not higher than its on-axis response scale up 20watts RMS. For example, sensored sensored have a sensitivity of 90dB, and should achieve 103dB SPL on-axis easily, when “Assuming source is omni directional” it is 103 + 20Log(r) + 10Log(4pr2) = 114dB.
However MLSSA’s technique plus scaling only produce 93.09dB. sensored ®’s Power Response result is also low at 96.07dB. If the summation and average was carry out in Excel, then MLSSA’s Sound Power curve produce 91.81dB, while sensored ®’s Power Response curve produce 94.26dB. Again around 3dB difference. Anyhow the two curve is nearly identical and may suggest sensored ® could be wrong to assume conventional method is not appropriate entirely, given a +3dB off set is needed.
sensored’s method is not entirely different except more elaborate, where it is still based on post processing of horizontal and vertical polar responses but at sensored ° intervals. The elaborate bit is each measurement point is divided by allocated sphere areas describe in AES pre-print #4970.
It is unknown at this point how to use the DI curve. Base on the close result of this method and sensored’s, this one is highly adaptable. A question of “Can all results be scaled another 3dB higher to match that of sensored ®’s?” This can be answered in future measurement and analysis.
The sensored’s
measurement was based 1V/1m, while the MLSSA’s was singaled at 2.83V/1m.
sensored also said MLSSA’s Sound Power
conversion is not complete and needs to add
![]() . When the suggested correction is applied, the 2 methods yield an exact same
level.
. When the suggested correction is applied, the 2 methods yield an exact same
level.
ACOUSTICS SECTION AUDIO SECTION CAR SECTION
HOME - Technical Website for Acoustics, Audio and Car